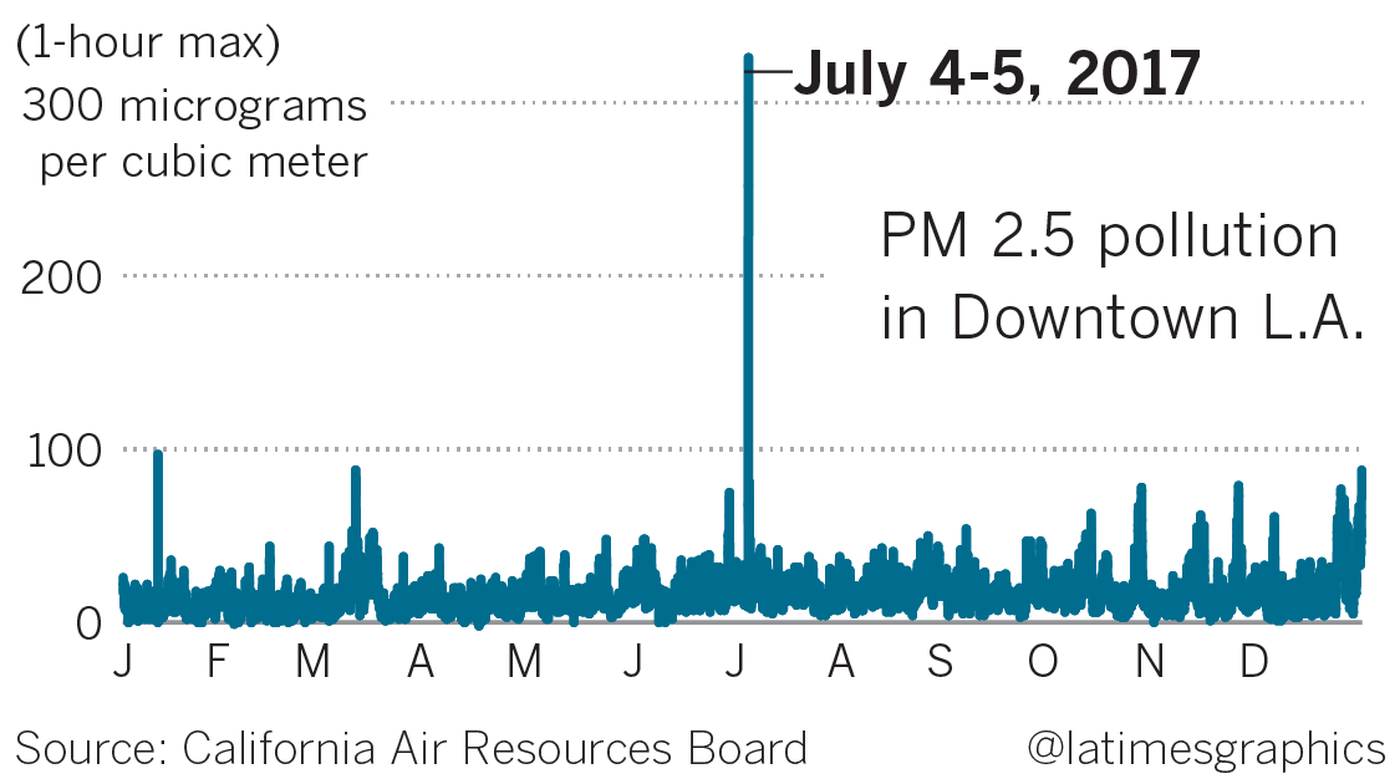
Air pollution spikes dramatically in July

Image

Image: LA Times

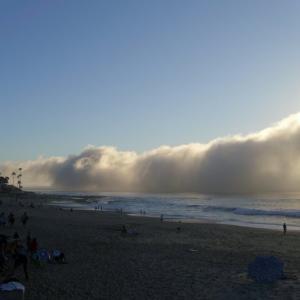
On July 5, 2018, San Diegans received cell phone notifications warning of poor air quality in San Diego. Similar warnings went out in 2017 and 2016 around the same time.

The graph above from the LA Times was generated using 2017 data from the California Air Resources Board. The graph shows a dramatic jump in air pollution around Los Angeles, and graphs using data collected from air monitoring stations closer to San Diego show a similar spike.

  • What is the cause-and-effect relationship behind this pattern?
  • What human-made event is causing this impact on the environment?
  • Where does this air pollution go?
  • How can we balance holiday celebrations and care for the environment?

Resources:

CA.gov,California Air Resource Board

LA Times,Fourth of July brings some of the year's worst pollution

AirNow.gov,California

Ages
Grade 6
Grade 7
Grade 8
Type
Phenomena
Subject
Earth and Space Science

More Activities & Resources:

What causes the Catalina eddy, and when does it typically appear?
Phenomena
Why does the ocean turn red?
Phenomena
San Diego's marine layer creates a cloud "curtain" that hovers over the coast.
Phenomena

The Fleet Science Center invites you to connect to the power of science through FLEETtv!